Android Studio
Because the majority of performance issues will being occurring in the JS thread using the React DevTools profiler is fine for the majority of performance measuring.
There can be times though where you need to hunt down memory leaks or other mysterious issues in performance on Android and in those cases the suite of tools available in Android Studio can come in handy. The Android Profiler Tools come with Android Studio, and can be opened automatically when running profile builds of the application.
The Android Profiler Tools provide real-time metrics of CPU, memory, network, and battery resources. The important note is that Android Profiler is compatible with Android 5.0 (API level 21) and higher. There are a few metrics that could be profiled using Android Profiler.
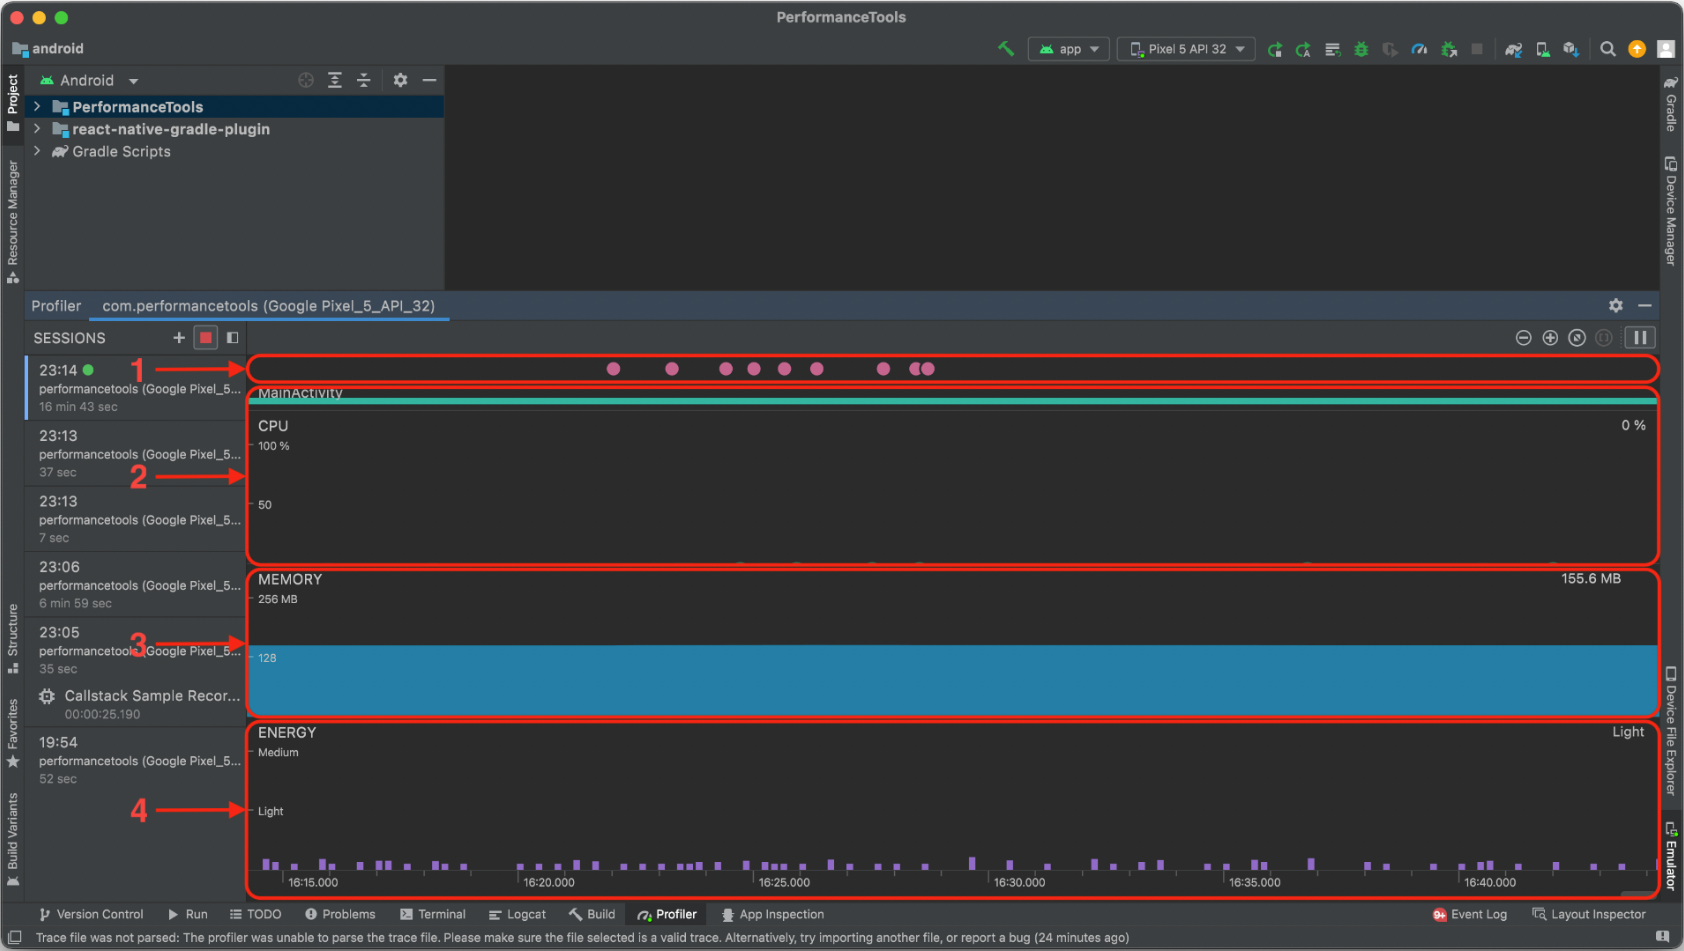
2 - CPU usage
3 - Memory usage
4 - Battery usage
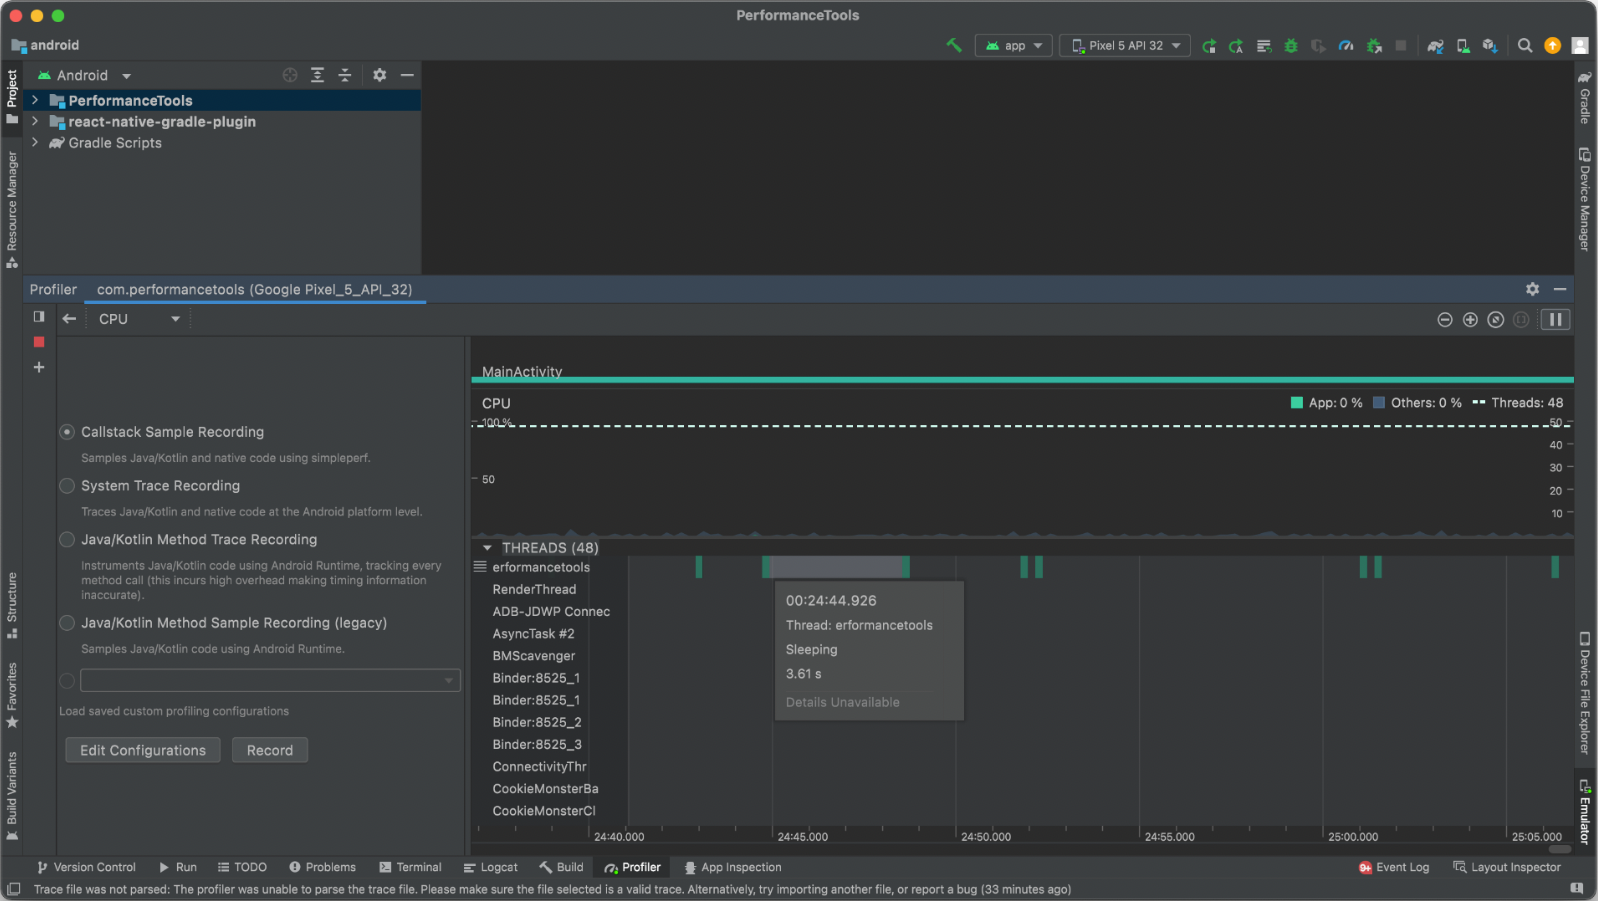
CPU Usage
One of the main performance metrics is CPU usage. Optimising the app’s CPU usage ensures we are providing a fast and smooth user experience, as well as saving device battery life. The Android Profiler has a CPU Profiler tool to investigate CPU usage, which contains the app's CPU usage and real-time thread activities while the app is running. It cam all be used to investigate the details in recorded method traces, function traces, and system traces.
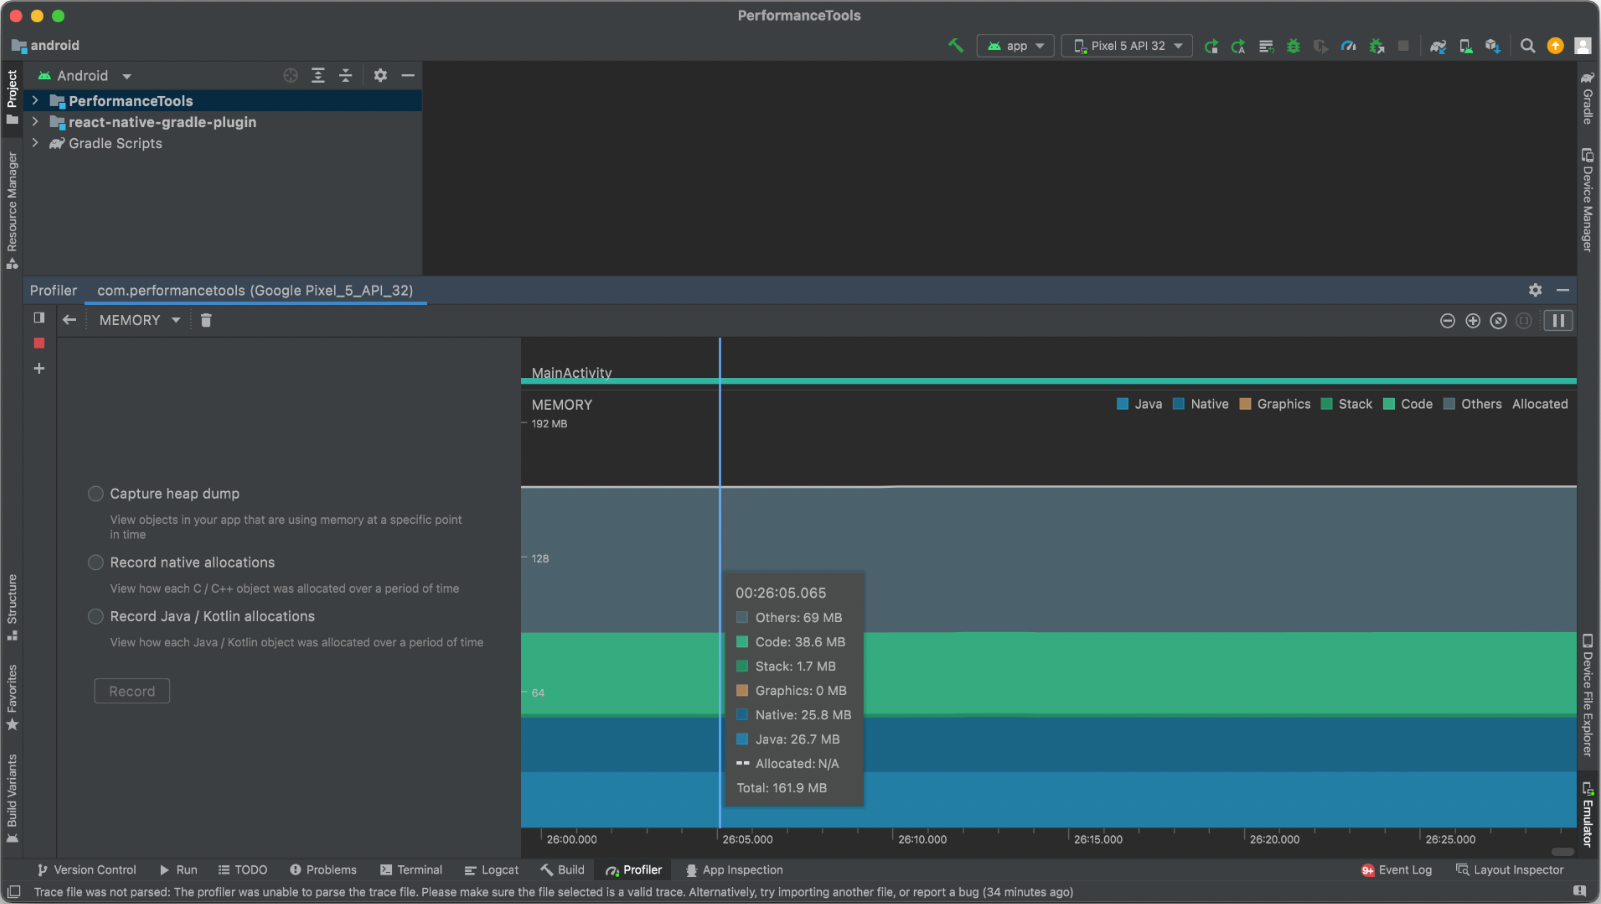
Memory Usage
Another crucial metric is memory usage. It can be used to identify memory leaks that can lead to stutter, freezes, and even app crashes. It shows the app's memory usage in real-time and helps to capture a heap dump, force garbage collections, and track memory allocations.
Why is memory usage important?
The problem is in the Android’s managed memory environment. It always checks if the app is not using some objects and then says to the garbage collector to release the unused memory back to the heap. At some point, the system should briefly pause the code when it tries to find unused memory. Usually, you can’t feel these pauses, but sometimes the app allocates memory faster than the system collects it, so the app could be delayed when the garbage collector frees the memory for the app. This delay can cause lags and FPS drops.
Sometimes memory leaks are a result of the fact that the application keeps using memory that isn't taken away from the system memory while the app is backgrounded, which can lead to lag and freezing of the entire device. As a result, the application may be closed and unloaded from memory to free up memory. Because of this, the application will be completely restarted when the user re-opens it.
The Memory Profiler can help prevent these kind of problems. Here are some suggestions on how to use the profiler effectively:
- Investigate real-time memory data to find unexpected allocations.
- Always track the Java heap to review memory usage by all the objects at any given time. This data in comparison could help to find and identify memory leaks.
- Record memory data in the worst scenarios of using the application to find more unexpected memory allocations.