Xcode
Because the majority of performance issues will being occurring in the JS thread using the React DevTools profiler is fine for the majority of performance measuring. There can be times though where you need to hunt down memory leaks or other mysterious issues in performance on iOS and in those cases the suite of tools available in Xcode can come in handy.
The most popular tool for profiling iOS is Xcode Instruments. It contains a bunch of different tools which can be used to identify things like memory leaks, measure CPU usage, identify bad practices in native code among many other things.
Xcode Instruments come built into Xcode and can be opened by going to Product ➔ Profile or by using the keyboard shortcut ⌘ + I. This will run a profile build of the app and open the tool selection menu.
The first instrument we'll look at is the Time Profiler. It provides real-time system CPU usage sampling and stack trace information on each running thread. Every thread has information about the heaviest stack trace, which helps to identify the most resource intensive processes. Double-tapping on a stack trace shows the code implementation of each performance hot spot, meaning easy finding and fixing of performance issues in the Swift code.
The most important thread in React Native applications is the Main Thread, which is responsible for rendering native components in the application. It can be selected in the Profiling track and contains extended information within the Detail area. Every process can be reviewed in terms of CPU usage, which will help to find and fix the most resource intensive processes.
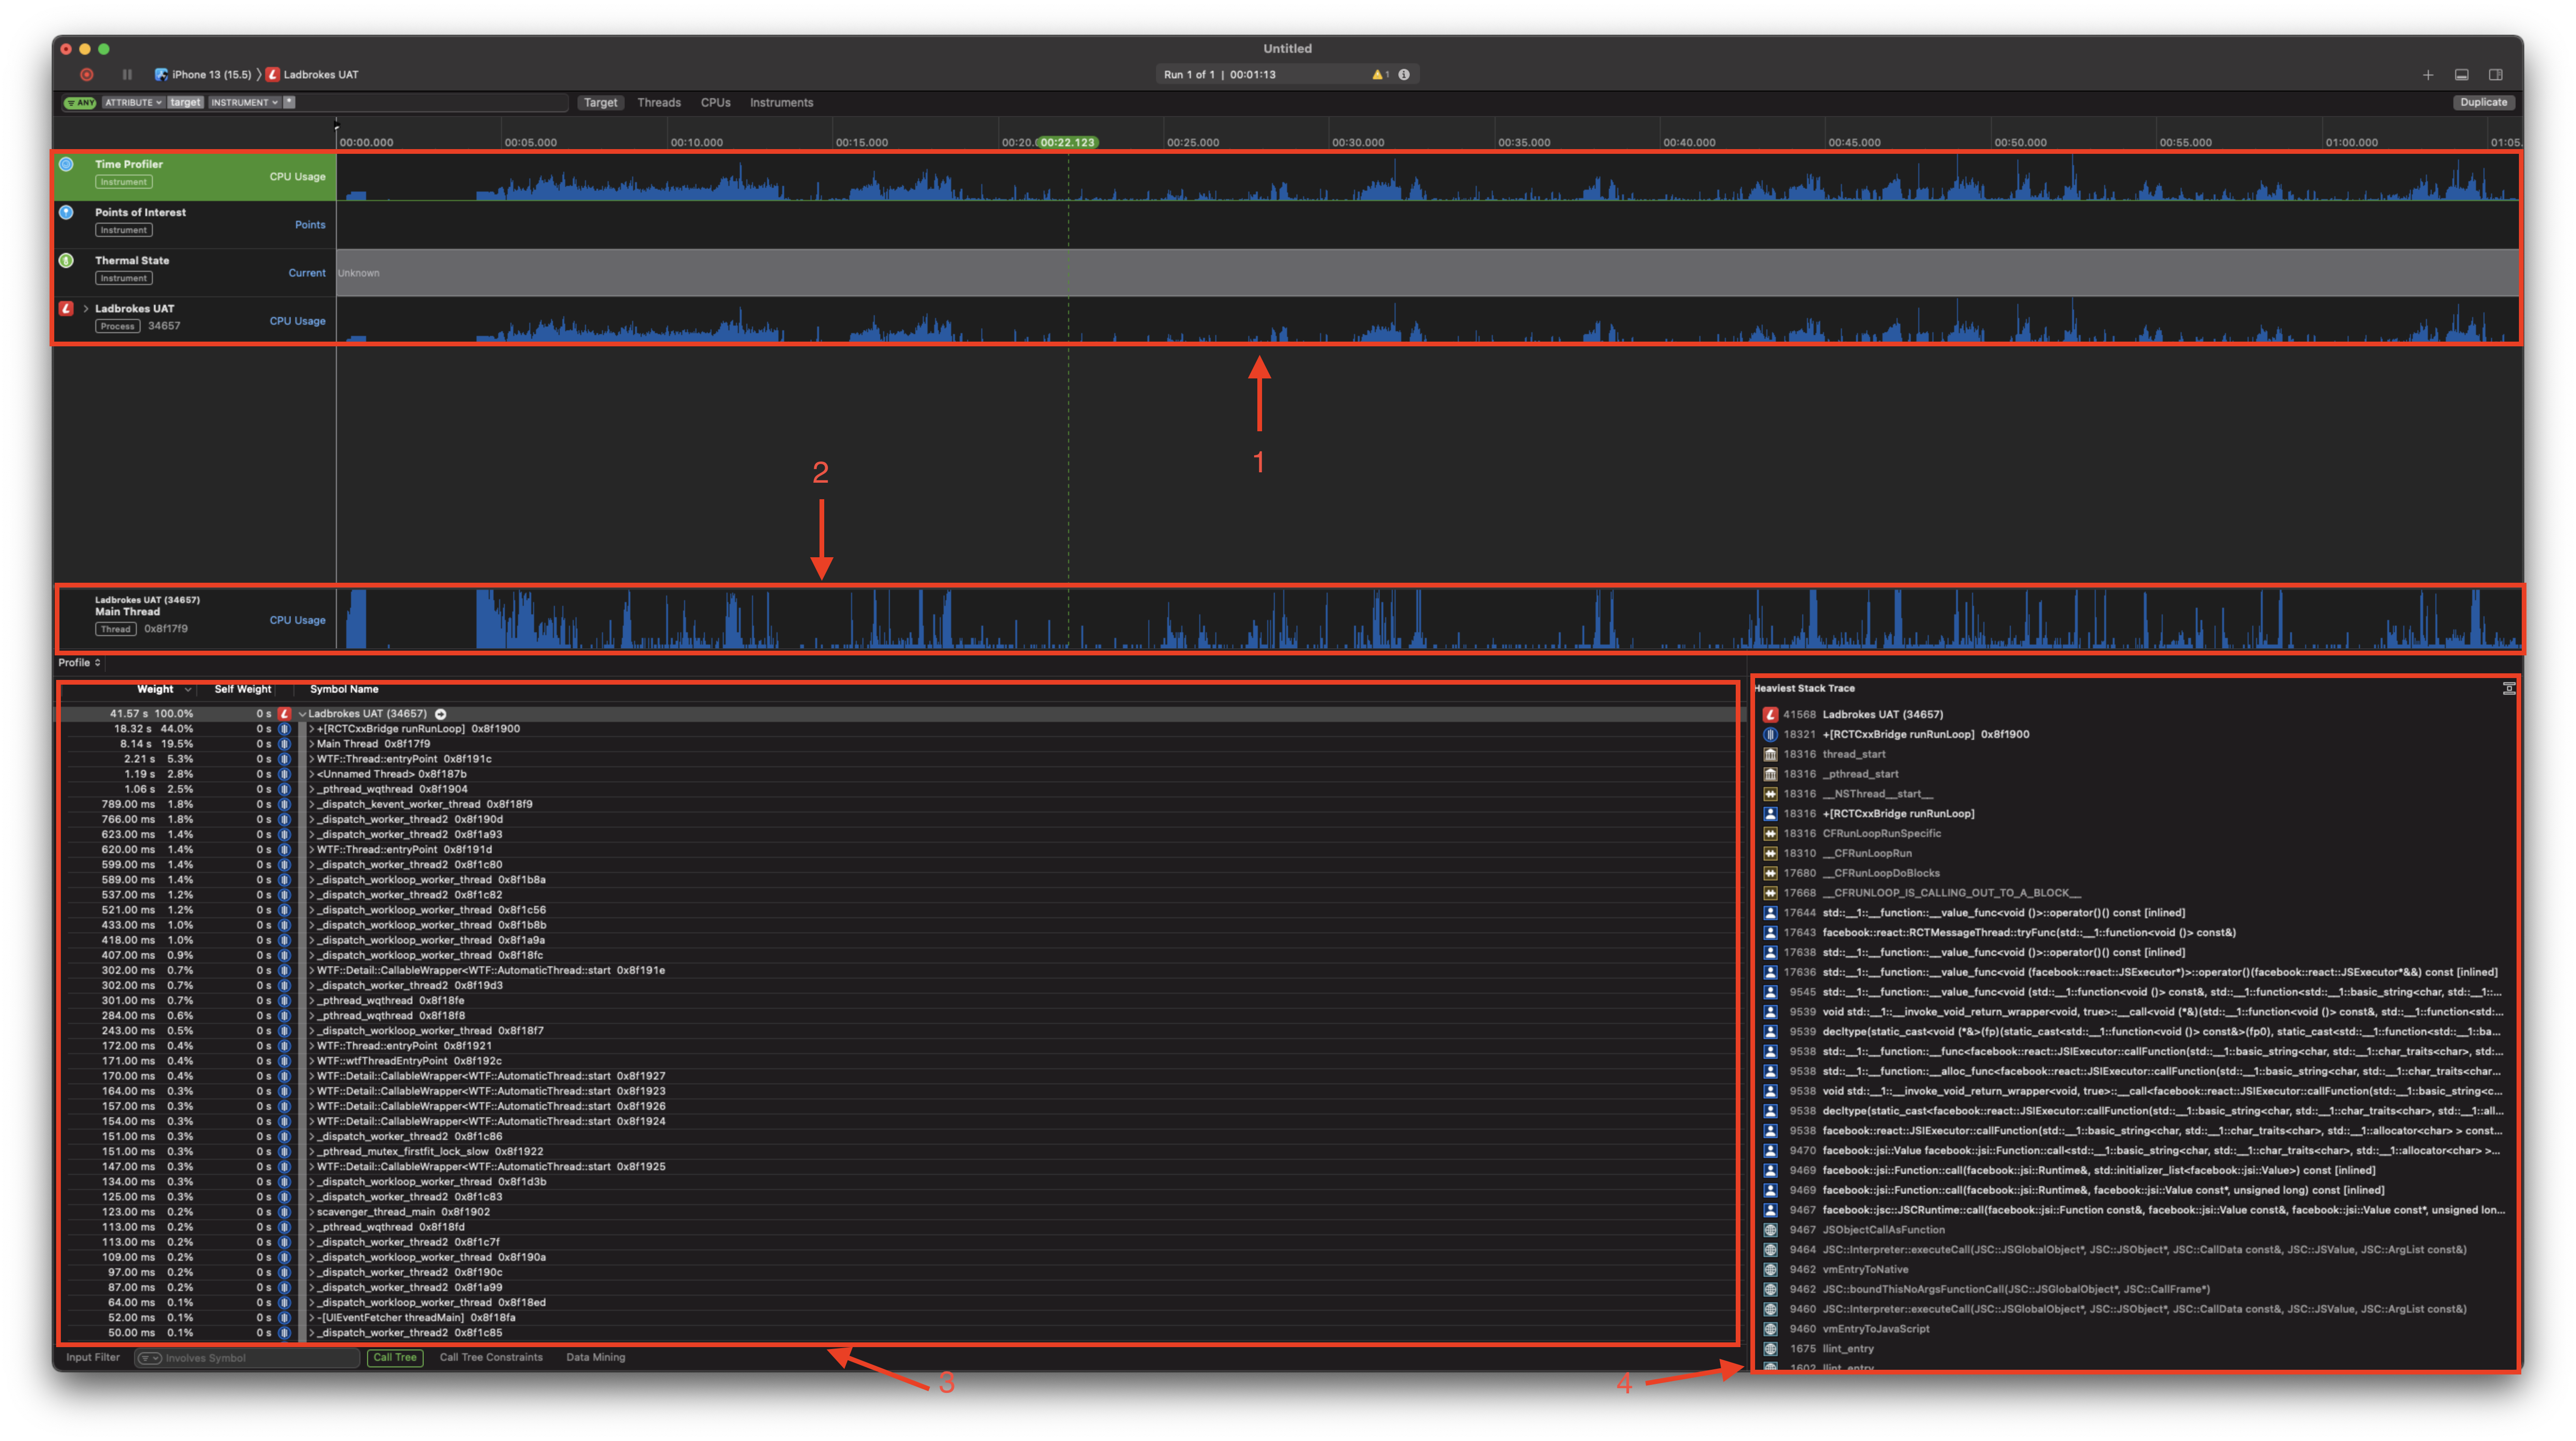
1 - Profiling graph
2 - Selected process profiling graph
3 - Details area
4 - Heaviest stack trace
Another useful tool in Xcode is the Leaks Instrument. This tool allows us to easily identify memory leaks, of which there are two types:
- True memory leaks: This kind of memory leak comes from an object that is not referenced by any other object, but the memory is still allocated for it. This can happen as a result of reference cycles. Sometimes one object holds a strong reference to another one, and this one holds a reference to the first one, that's why it's called a cycle. So every object keeps another one from being deallocated. As a result, their memory is never released.
- Unbounded memory growth: This means the memory is allocated continuously and never deallocated. The system will eventually run out of memory and terminate the application.
This instrument gives you detailed information about all the objects your app creates and the memory used by the app. It also shows you retain counts of each object.
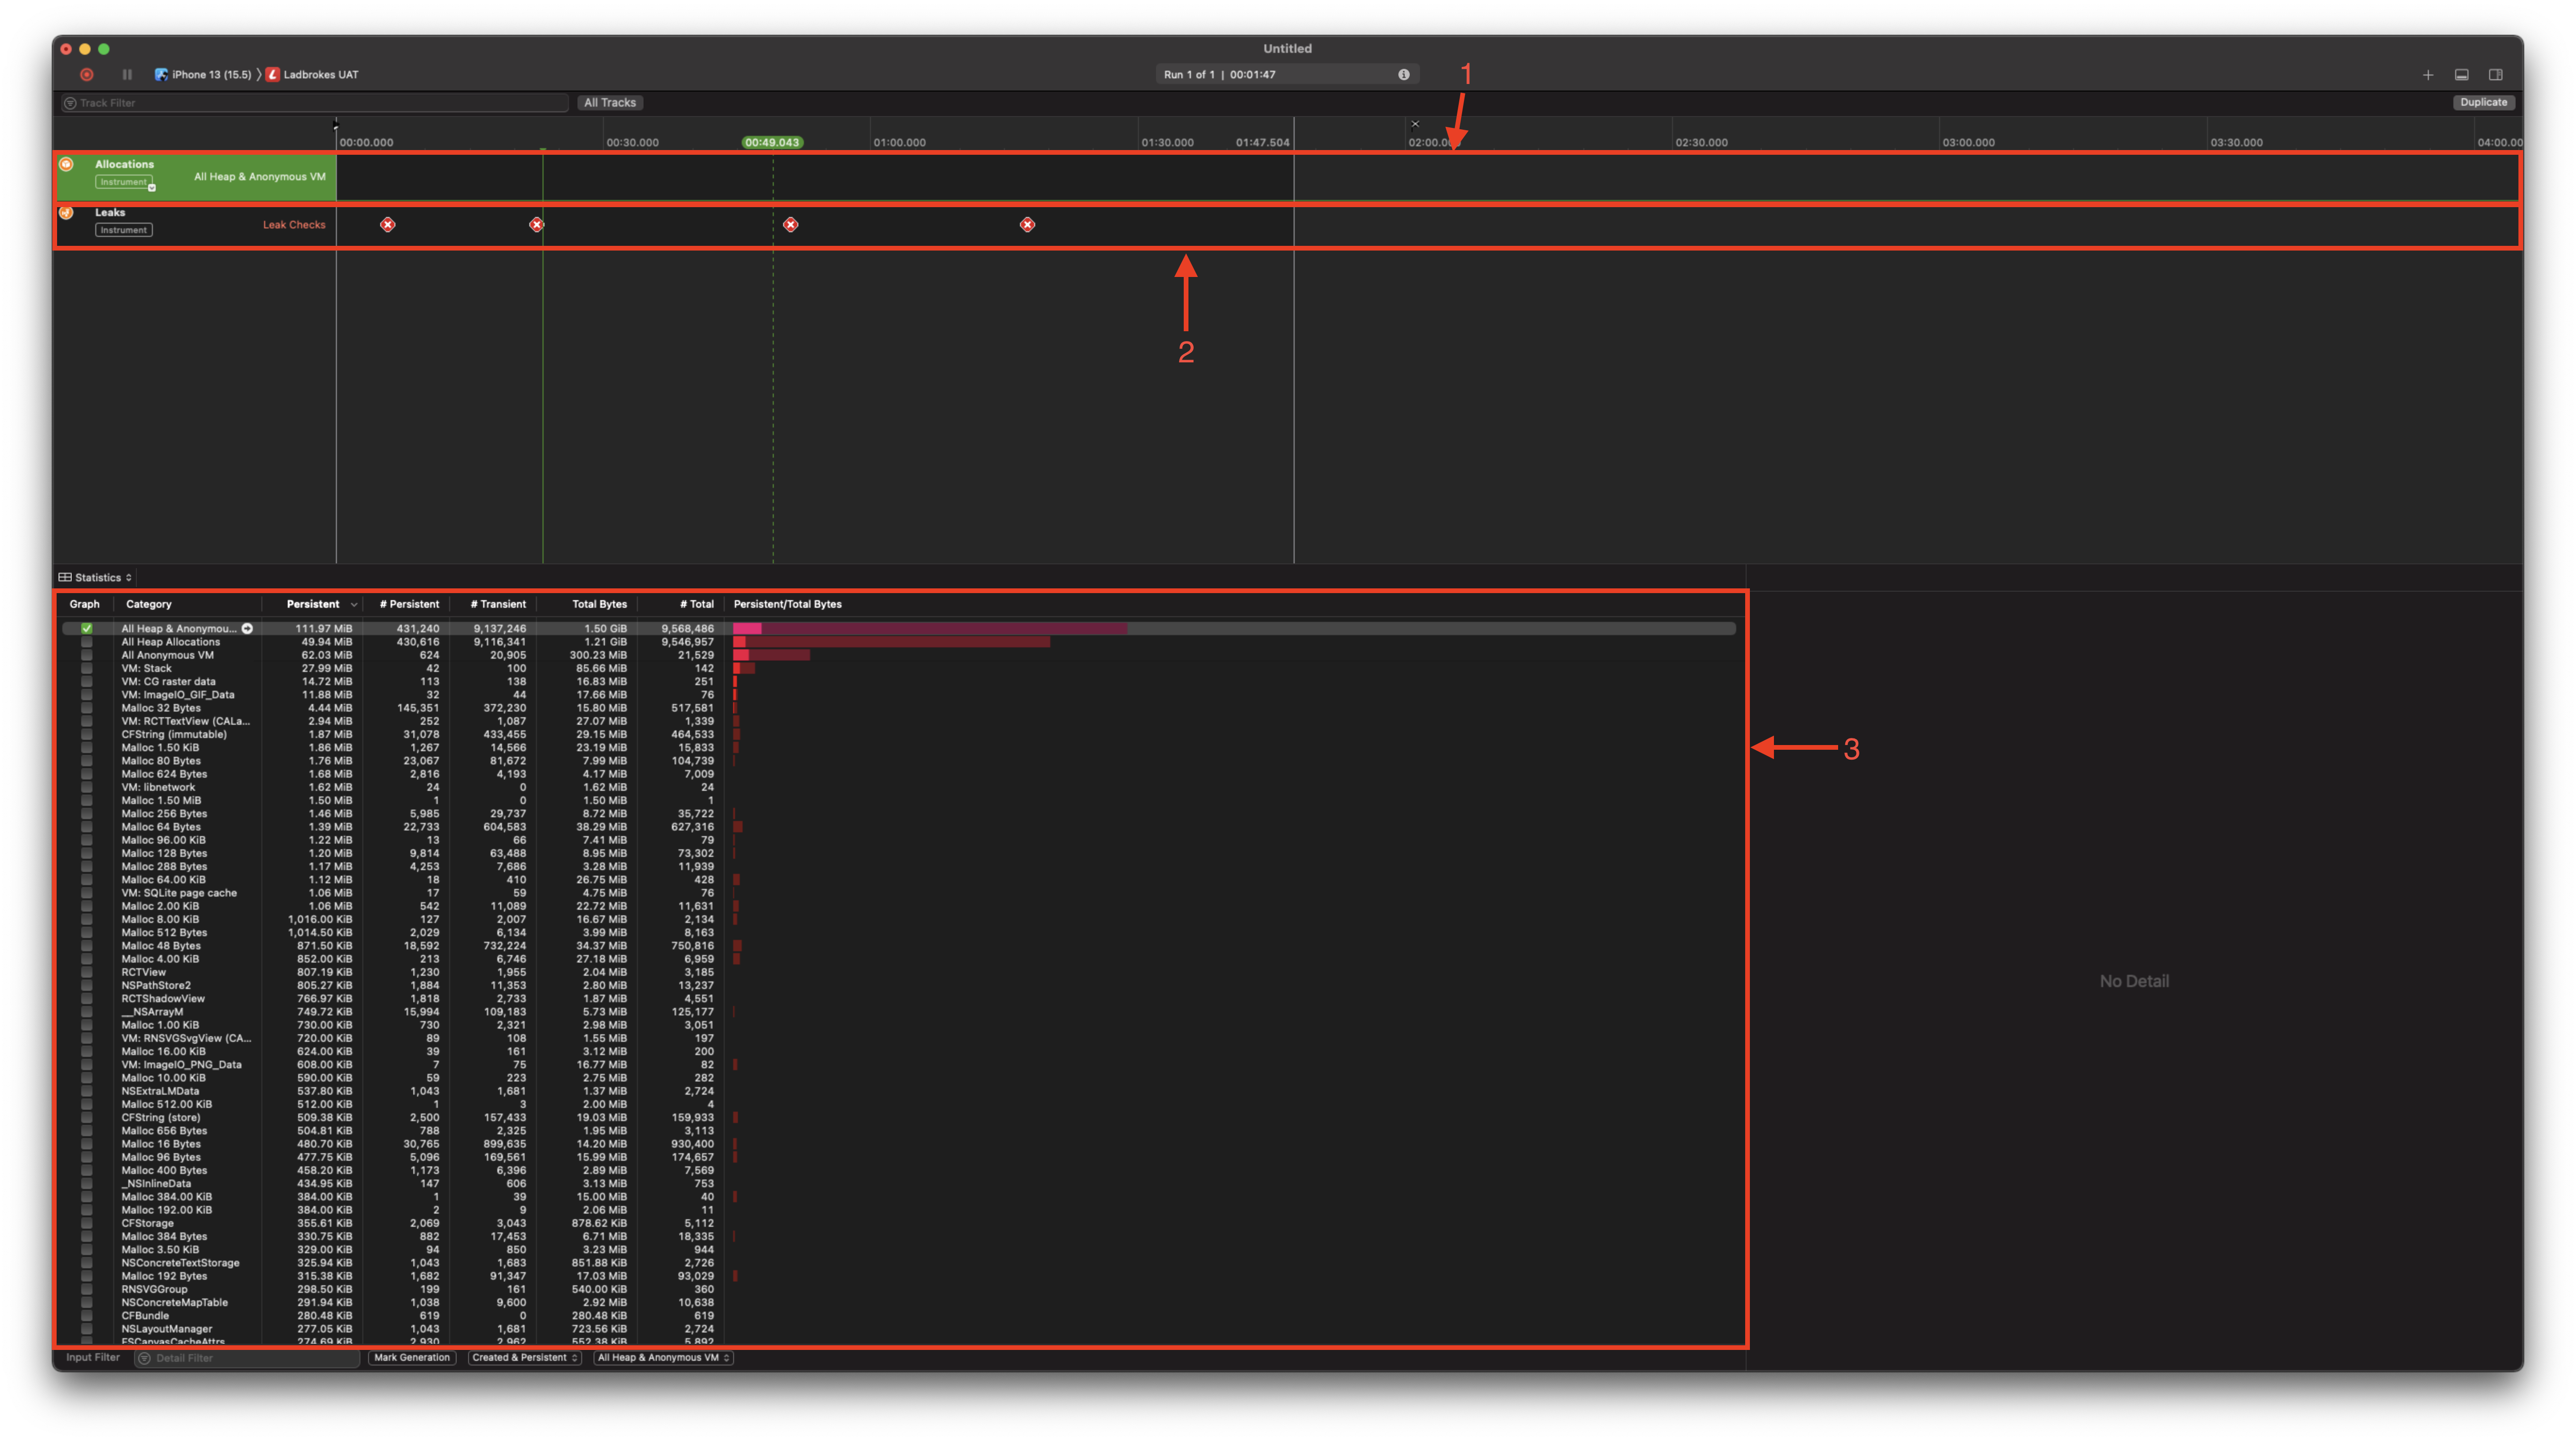
1 - Memory graph
2 - Memory leaks check
3 - List of objects