React DevTools
React DevTools ships with a profiling tool that is super helpful when evaluating React applications. It gives you the ability to view component render sequences, and drill down into the details of each individual render.
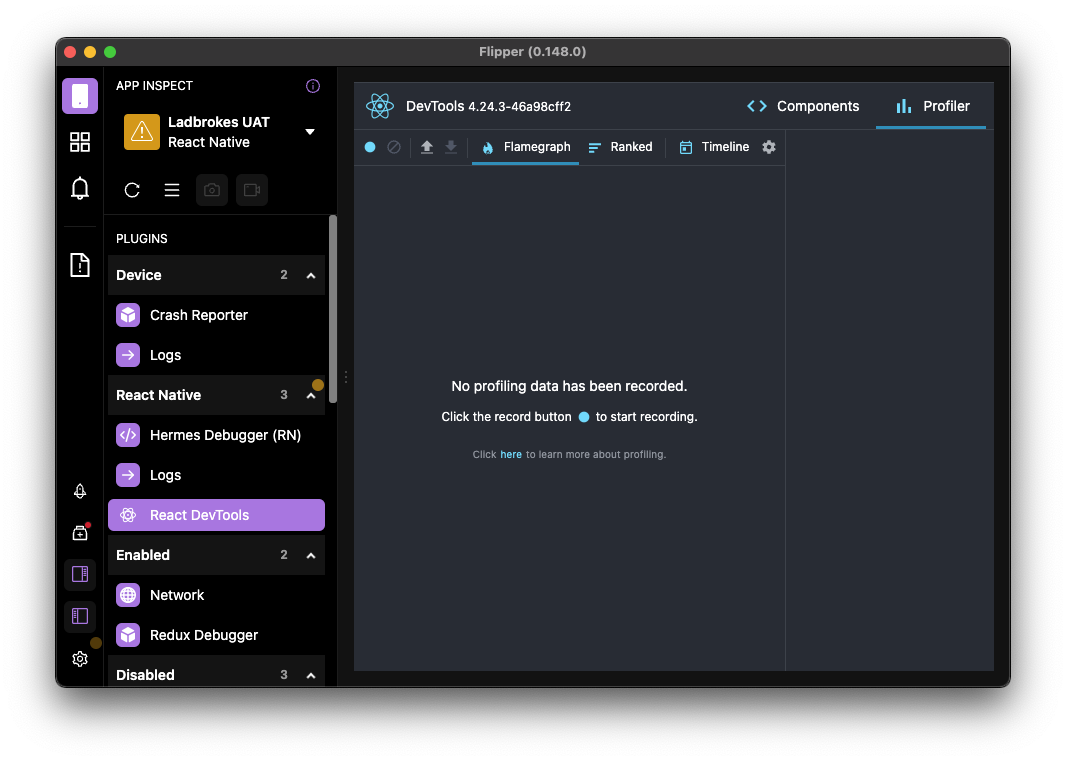 Note: This is an image of the DevTools in the now removed Flipper, but it looks the same regardless of where you use it.
Running the profiler
To start profiling, launch the app and in your terminal run npx react-devtools. This should open a window with steps to connect to the app running on the simulator. Once connected and the dev tools have opened, press the record button to start the profiler.

Once the profiler has started, carry out the scenario in app that you want to analyse. For example, this could be placing a bet, joining a group mode chat group, logging in, etc. Once you have finished what you want to profile, stop the profiler using the same button used to start.
Analysing results
Once the profiler has stopped you should see the screen populate with a bunch of information.
Sequence of renders
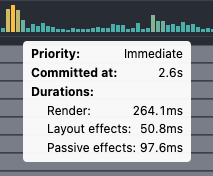
The primary tab we will be using to analyse our results is the Flamegraph tab. In the top right corner you should be able to see the sequence of render commits that occurred during your profiling.

This chart tells the number of React commits, with each bar representing a change to the component tree and the height of the bar indicating the time it took. The higher the bar the longer it took for a given render. You can hover over any of these bars to view the total render duration.
Analysing renders for a single commit
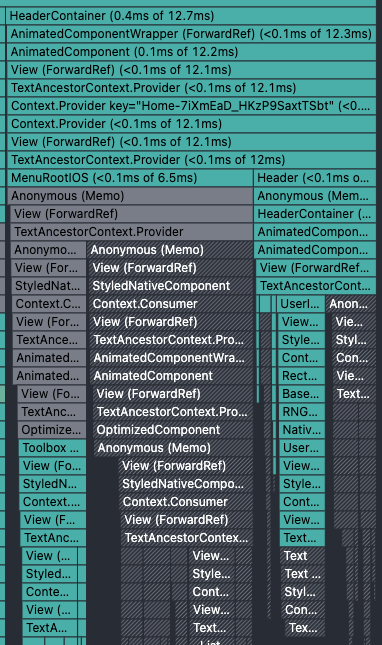
In the body of the profiler you can see the app's component tree. Initially this can be fairly overwhelming due to the number of components displayed, but it's easy to drill down and isolate the specific area you want to profile.
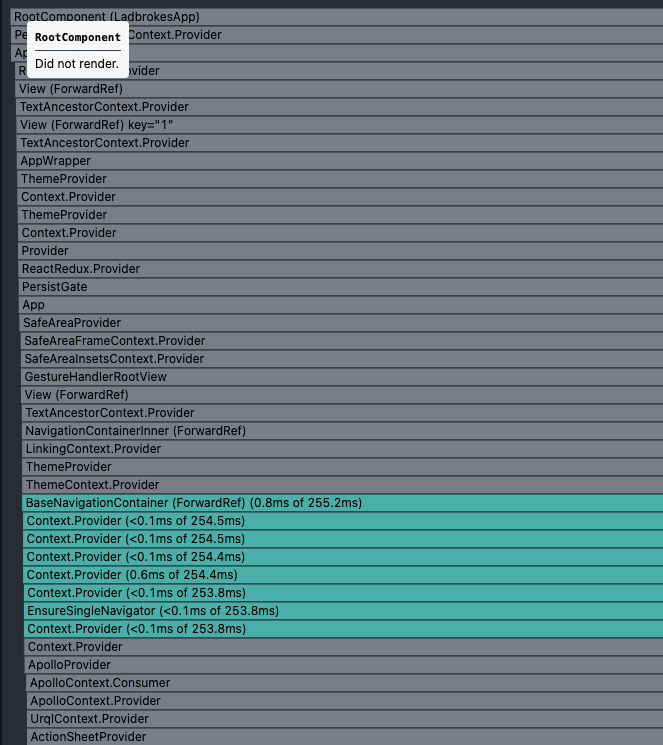
The light grey represents components that didn't render during a given commit. The green, yellow, and orange components are ones that did render.
By default, when a component renders, so too does all of its descendants. This waterfall of renders can be stopped when a component in the tree is memoised.
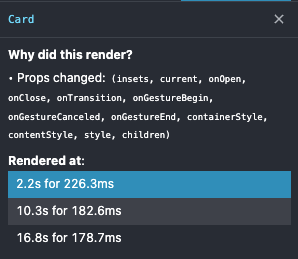
If you hover over a render it will display the time it took to perform that render (here 0.3ms), as well as total time it took to render that given tree (here 226.3ms). It will also give you the reason for rendering, in this example Hook 5 changed. If you aren't seeing the render reason, be sure to enable it in the settings in the top bar.
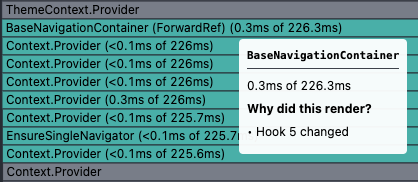
When you click on an individual render the panel on the right hand side will show you the reason for that render, as well as render time.
When the render tree gets too dense, it's possible to drill down even further to narrow the scope of renders. By clicking on a lower down commit it will expand that section of the tree.
In this image you can see the renders have become fairly condensed and diffifcult to read.
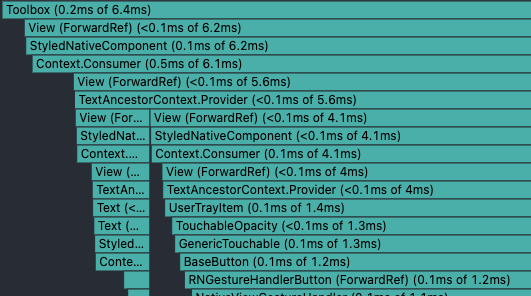
By clicking on the render with Toolbox ... in it, we can expand it for a better view of that section of the render tree.
The indentation of a render indicates how long it took before accounting for any of its children. In the example below we can see significant indentation because of how long the render for RaceCardProvider took. The colour is also an indicator of render time:
- Yellow means a component took a long time to render.
- Blue means a component didn't take long to render.
- Grey means it didn't render.
Because RaceCardProvider took 34.2ms to render it is significantly more indented than its descendants, and is coloured in yellow.

Example analysis
Say we've run our profiler and have drilled down through the components and want to analyse the findings.
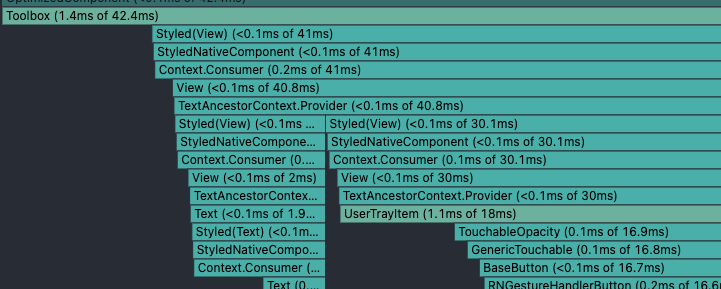
Here we are looking at the Toolbox component, and can see that its tree of renders for which it's the root, took 42.4ms. Judging by the colour and indentation it's fairly slow. We can also use the colour, indentation and render time of its descendants to work out what is taking up the bulk of that time.
The large indentation means the render of the Toolbox component is taking up a lot of the time, but children such as UserTrayItem are also taking up a non insignificant portion of that. The portion of a render that is taken up by another and all its descendants indicates how much of that render it took up.